16th February 2018 – I am starting to realise that trading only in the evenings seriously reduces the number of trading possibilities that I have in any given week. Using a four to six hour window to look across the European evening forex markets, I am really having to be disciplined to not jump in to setups that I see too late (but think I can still make pips) or take trades on weaker setups that I am trying to avoid.
On the one hand, this restricts the number of trades that I see when I look back at the markets, but on the other hand helps me to develop my patience and selectivity. Given that all of the advice to novice traders point to over-trading as a major reason why we all fail in the end, this restriction is perhaps helping me to avoid this pitfall, for the moment at least.
New Lessons
One additional bonus to having more inactive time looking at the markets is that it is helping me to develop my own trading preferences and review historical setups that I like in detail. I am pretty much set on the idea that I can try to make money using the concepts of support and resistance and I am trying to involve this in every setup that I am looking for.
Simple observations are also becoming useful for me, such as the fact that price seems to react most at the open or close of the 15 minute support and resistance levels, whereas on the hourly charts, price generally prefers to react at the highs or lows of the candles signaling these levels.
Fibonacci Levels
I am becoming increasing interested in the theory of the Fibonacci levels as I try to establish whether a support level can be considered as viable. I have been placing these levels on as many charts as I can to see if they demonstrate a nice confluence with the support levels that I am also adding on a daily basis. I generally delete the previous day’s lines and add fresh lines every 48 hours to help avoid the confusion of hundreds of lines cluttering my charts.
The Fibonacci levels help me to try to really see where I have an agreement with where I think price should react as well as providing good take-profit levels. The strategy that I am currently trying to employ, and the basis for my first trade in 2 weeks below, is that when prices rebounds of a strong Fibonacci level, it will move up or down to the next nearest fib level. I have monitored this on several occasions and, with a bit of patience (or nerve!) and a well-positioned stop-loss, this strategy has worked out and provides as good risk:reward ratio.
Working with Fibonacci and support and resistance trades means that I am looking to place orders in the market which are triggered when price hits the levels that I think are most important. These will always be counter trades with the assumption that price will bounce of the level enough for me to make at least 10 pips and reinforce the idea that it is at least a short term support or resistance zone.
Hoping for the Best, Planning for the Worst
As the worrying type that I am, I am trying to also incorporate a “what-if” strategy for those occasions (which there will be many I am sure), or a plan B where price smashes through the level and gives me a losing trade. This is a worryingly common occurrence, however, the flip-side is literally that these areas themselves seem to “flip” to previous support zones now become resistance zones and vice versa. I am currently trying to expand my strategy to include this fact to help recover losses when a level fails to push price in the other direction. I need to do a lot more research around this idea, but it is something which is developing the more I look at the charts and think about reducing the possibility of losses.
AUDUSD Trade
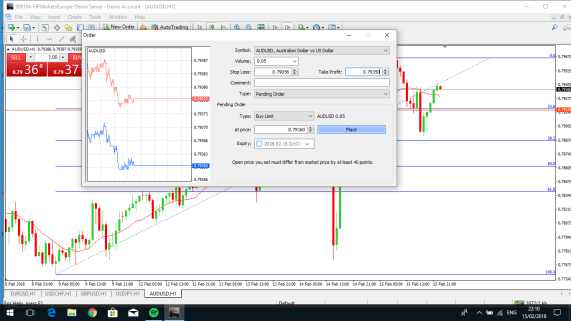
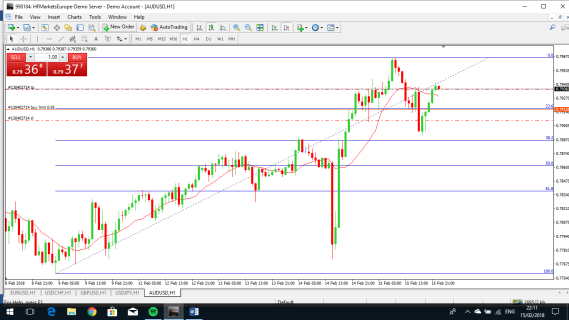
For my third trade I placed the below Fibonacci long order in the market to trigger at the price of 0.79171 on the AUDUSD. The idea is that I should see price action in the form of a bounce because there is not only the 23.6 fib level based on a recent high and low, but also a historic minor support level based on recent price action. Following the idea that it would bounce to the next fib level, this has been placed as the take profit level with the aim to put the trade to break-even once 10 pips is achieved. The stop loss placed above the nearest support/resistance level.


The trade order size was a mini 0.05 lot this time, as I am still experimenting with the use of Fibonacci levels and I want to limit my exposure trading these levels initially.
Trade Post-Mortem
Over the next few hours price actually created a new high in the early European trading session. Unfortunately, I was unable to monitor this and adjust the Fibonacci levels or cancel the original order so the order remained live in the market. I think this was my first major mistake and I need to review how I can get to monitor my trades and cancel orders if the market conditions change, even when I am working.
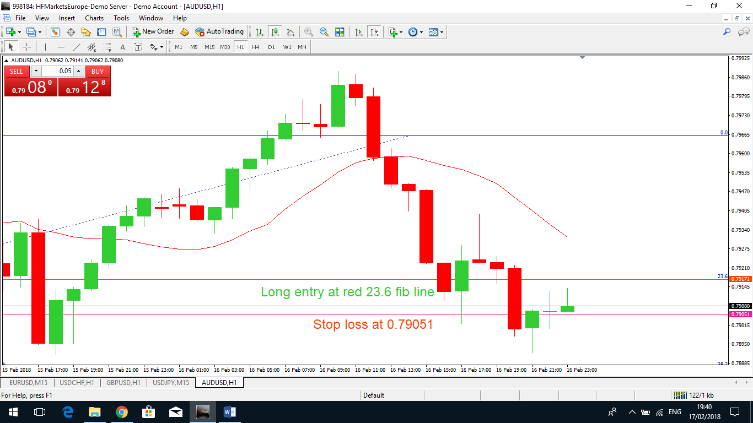
The second mistake was that I made was my stop-loss level. The trade triggered in the afternoon and price then spiked down (the first green candle) to take out my stop before moving higher 23 pips higher in the following hour. If my stop had been further away, I could have moved the trade to break-even after 10 pips and avoid this loss.

What I have learnt from my third trade is that I seriously need to review the stop loss positioning on these currency pairs to ensure that my orders allow trades at support and resistance zones to breathe. I am not yet convinced of the fib levels but they could be a useful analysis for my future trades, and in looking for other technical setups.
My trading balance after the 3rd trade which resulted only in a 5.20 USD loss, using a mini 0.05 Lot, is 5,399.87 USD in my Hotforex demo account.


