March 8, 2018 – After having mixed success with combining the support and resistance areas with the Fibonacci setups in my previous trades, I have decided to try to study these more closely before taking any more trades. I am particularly interested in the areas of support or resistance which coincide with one of the Fibonacci levels but, after looking back at my trades and other potential setups over the past week, I need to clarify two things before taking more live trades.
The first thing I have learnt from my two most recent trades is that I need to try to establish which of the Fibonacci levels are the most successful for the types of bounce trades that I am looking to take (I think that this would probably qualify as scalping). The next series of studies that I need to undertake are to look at how to create a more positive risk v reward ratio to ensure that, even if I have one winner and one loser, the overall outcome will be profitable.
I have decided to continue looking for opportunities with this combination and “paper trading” (simulating trades visually without using the demo account). I hope to then return to this setup, which I think has a lot of potential and suits my trading personality, within the next few weeks with a more robust strategy.
Looking for a high-probability trade: the 1-2-3 setup
For my next trade I am going to try to follow the so-called “1-2-3 setup” which I see occur every day and on every timeframe. It is one of the most basic but popular setups out there but has the potential to be very profitable because of the risk:reward ratio. In hindsight it looks like one of the most successful trades on the 15 minute timeframe, but this of course applies to a lot of setups when I look back on the charts. Spotting the most profitable trades in real time is the most difficult skill to master and I have been working on my ability to spot which trades will have the momentum necessary to make them high probability.
The 1-2-3 trade is a momentum setup based on the idea that price does not always move in a straight line. If it is rising or falling in a clear trend, it will always have periodic pullbacks when profits are taken or reverse trades are made. These pullbacks can range from a single 1 minute bar to a number of days or months, depending on the timeframe. The basis of the trade is to determine that the trend and momentum is moving strongly higher or low and use the consolidation pullbacks to join the trade in the dominant direction. This gives it the name 1-2-3 and I am going to try to use this concept to take my next trade. Below is an example of the type of trade setup that I am going to try to find.
Finding the setup and live trading
The thing that is striking about this setup if that it looks incredibly common and successful. The first thing that I have been looking for is the sign of a trend (ideally the start of a trend) higher or lower. I have noticed that the market’s volatility on some pairs is better for generating this momentum to make this trade profitable within a short period of time. I am also going to try to look for the shallowest pullbacks as this would suggest that the momentum of the dominant trend is strong with less other traders looking for a substantial reversal.
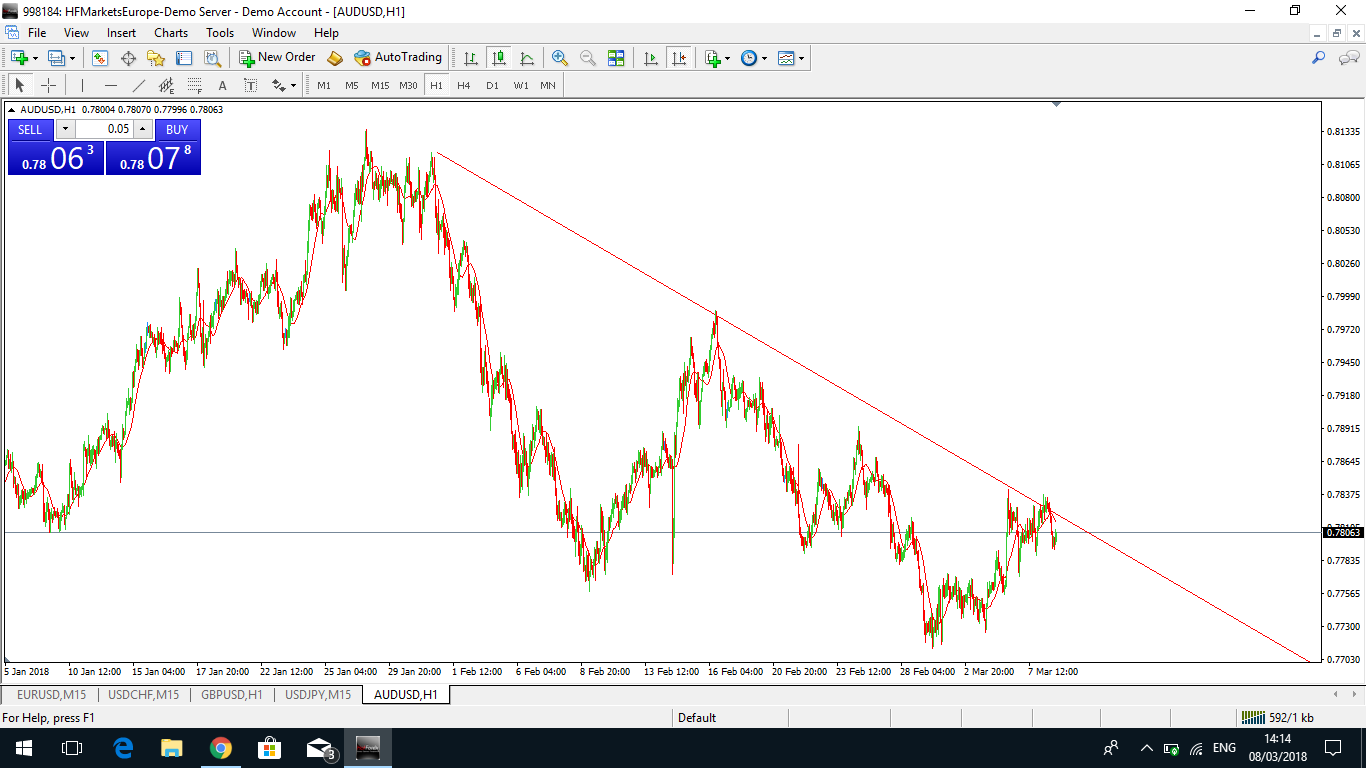
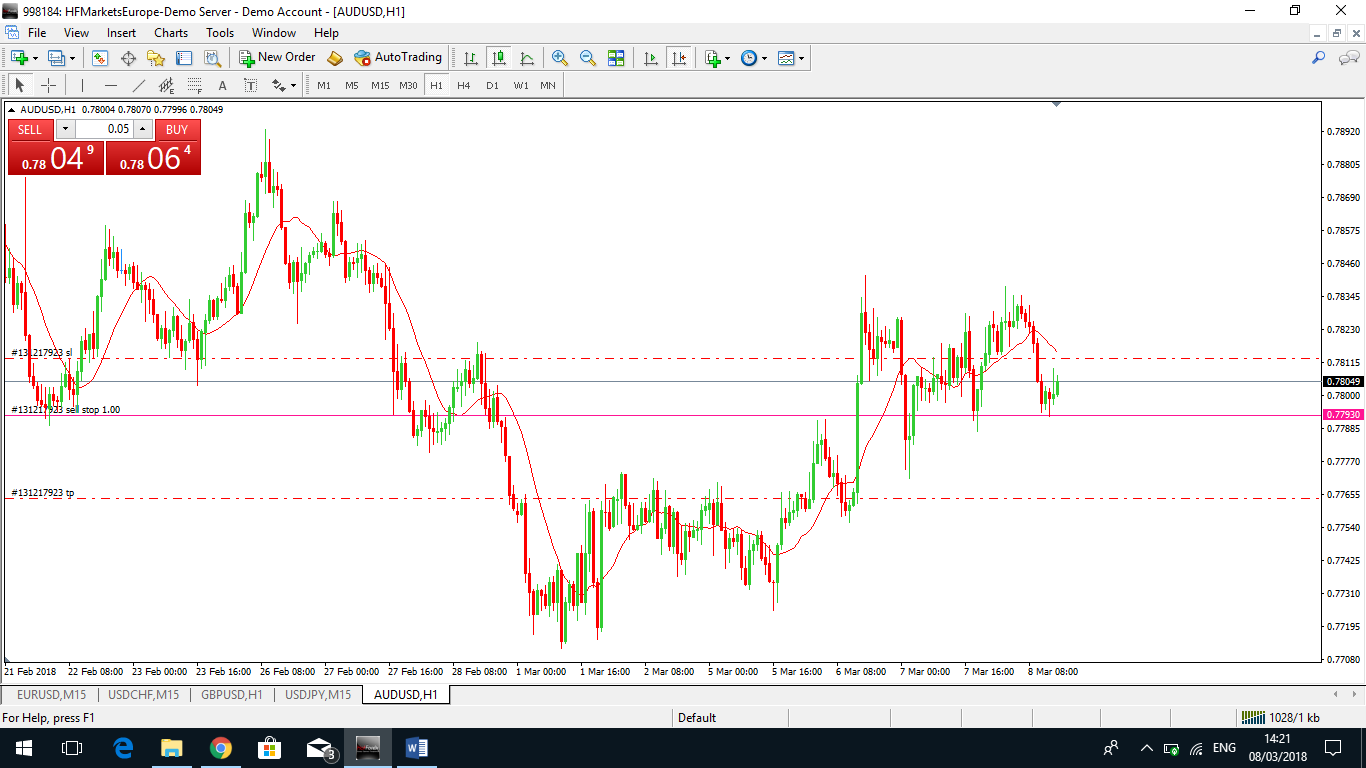
Below is the first potential trade that I have seen during my evening trading window on the AUDUSD 1 hour timeframe. The long-term momentum looked decidedly down from the end of January 2018 and the recent rally seemed to be reversing with the main trend. Within this reversal, I spotted a shallow pullback was a shallow 4 bars and just 6 pips long. I thought that this has got to be a continuation pullback and perfect 1-2-3 setup!

I placed the trade order at 0.7793 and a stop order at 0.7813, just a few pips above the level of the pullback. The take profit level was 3 times the stop loss level at 0.7763. Although I have seen some good examples of these trades going much further than this, I want to ensure that I don’t get too greedy with this until I feel confident enough to trade for larger profits.
How the 1-2-3 trade played out and analysis for improvement
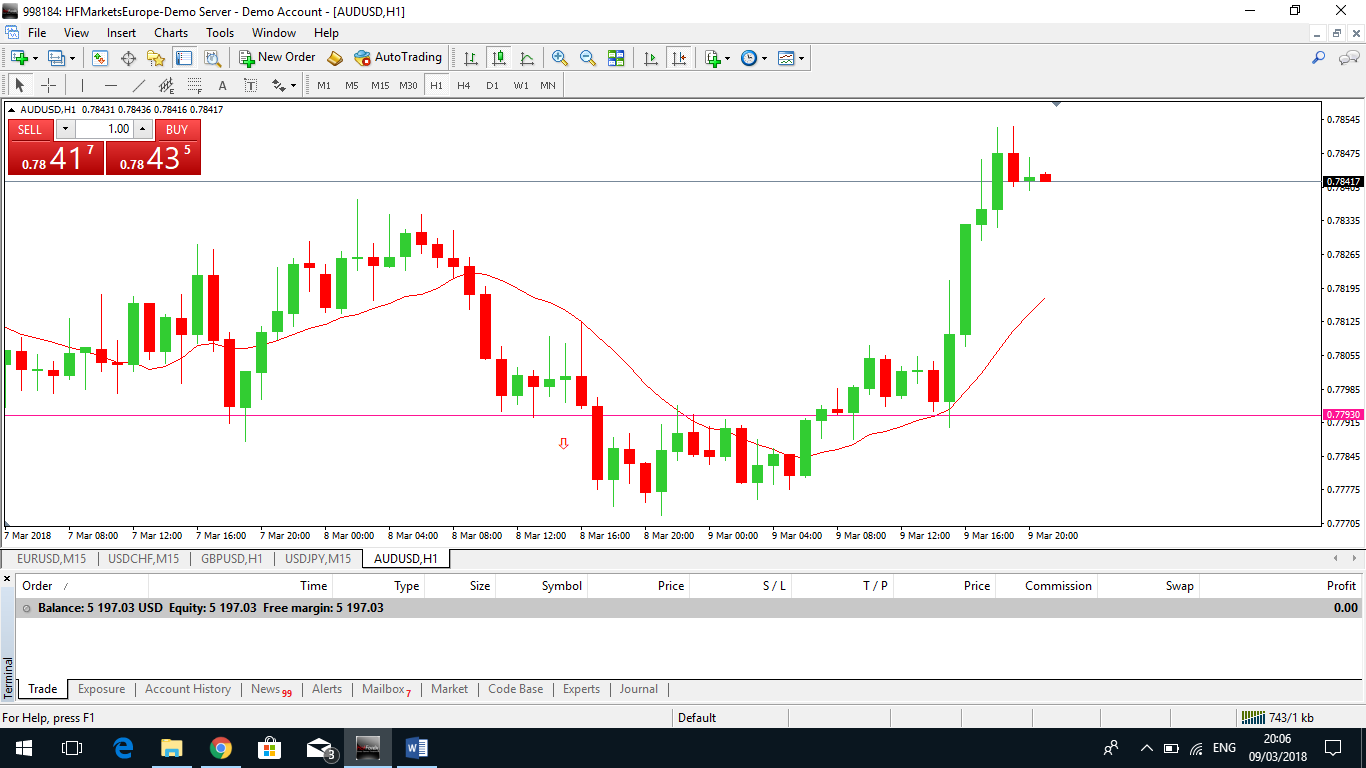
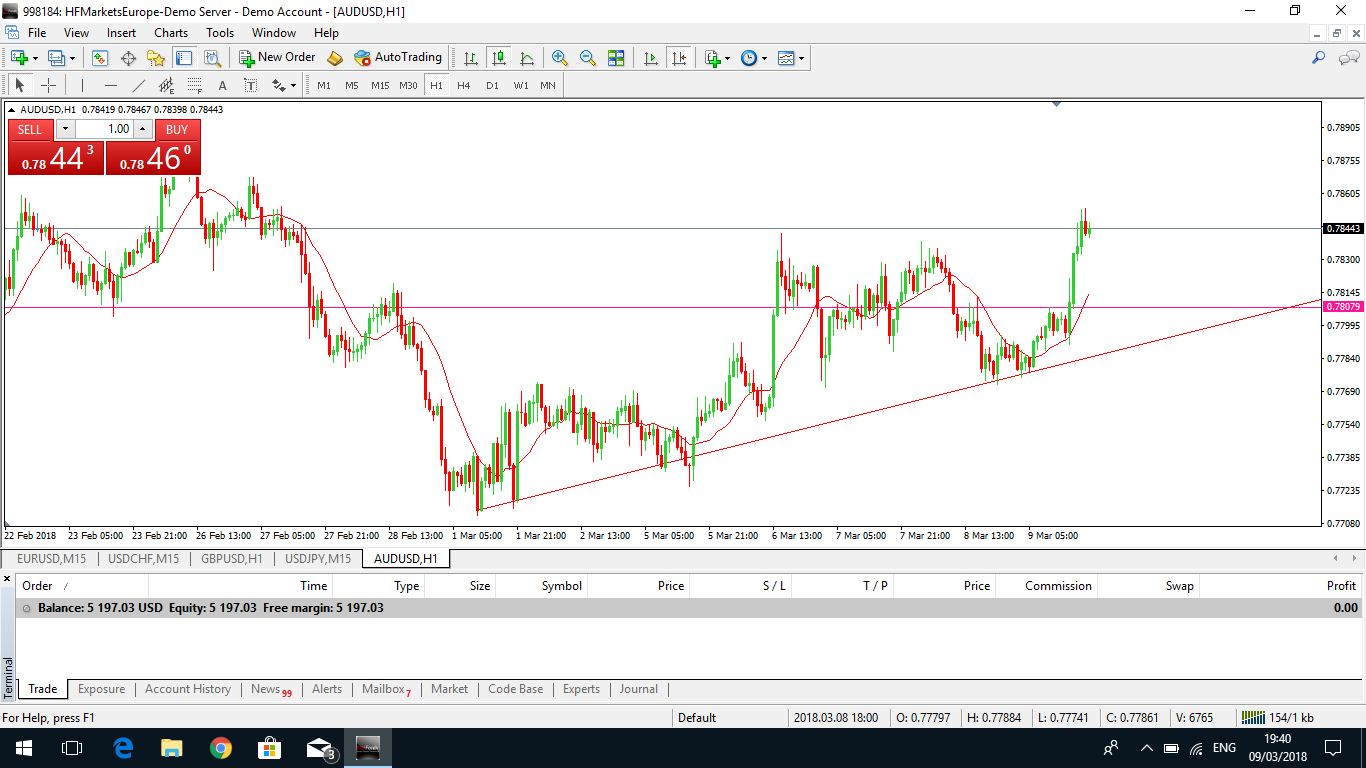
As the chart below shows, price moved in my favour over the next few hours, hitting 20 pips of profit before stalling and reversing against me. To say that I felt demoralized by this is an understatement. Hindsight is a wonderful thing, but if my take profit had been just 2 times the stop, still a healthy 1:2 risk reward ratio, I would have closed a profitable trade. Had I been too greedy?

On further analysis, I realized that whilst I had been focused on the long-term trend, I had failed to see the formation of a shorter-term supporting trend line immediately below my short trade. Looking back at the price action, the first sign that price was struggling to go lower should have indicated to me that the trend line was holding firm. Although I am annoyed at my greed for wanting the maximum profit, the most frustrating thing is that price continued higher and formed some beautifully-successful 1-2-3 setups on the way.

At the very least, I have learnt from this trade to be vigilant of trading in the direction of shorter-term trends and I am fairly pleased with my analysis of why the trade failed to hit my take profit level.
After this trade the balance of my account stands at: 5197,03 USD.

